
On this page
Summary: EN 689 is the European standard for assessing inhalation exposure to chemical agents and testing workplaces against occupational exposure limits (OELs). The standard requires not just a TWA measurement, but a statistically-grounded compliance verdict that explicitly accounts for workplace variability and measurement uncertainty. The Upper Tolerance Limit (UTL) is the standard tool: a statistical upper bound below which — with specified confidence — a specified percentage of exposures fall. EN 689 uses the 95th percentile at 70% confidence (UTL₉₅,₇₀). DOHSBase Online computes UTL via Monte Carlo simulation (typically 800,000 samples), based on the open-source methodology of Emonds, Scheffers and Van Balen, and connects directly to the DOHSBase OEL and kick-off-value database for one-pass EN 689 compliance assessment.
What EN 689 requires
EN 689 — published by CEN and adopted nationally as NEN-EN 689 (Netherlands), BS EN 689 (UK), DIN EN 689 (Germany), NF EN 689 (France) and equivalents — is the European standard for the determination and assessment of inhalation exposure to chemical agents at workplaces. It specifies how occupational hygienists collect measurements and how those measurements translate into a formal compliance verdict: does the work process meet the applicable OEL, or is additional exposure reduction required?
The EN 689 workflow has four steps:
- Select a Similar Exposure Group (SEG) — a group of workers with comparable exposures based on tasks and process characteristics
- Collect 8-hour time-weighted average (TWA) measurements — typically six or more personal air samples spread across representative working days
- Test statistically against the OEL — not as a simple average comparison, but with a defensible statistical criterion that incorporates uncertainty
- Render a compliance verdict — does the SEG meet the OEL, or are additional control measures required
For substances with a formal OEL (8-hour TWA, STEL, or ceiling value), that limit is the test reference. For substances without a formal limit, the DOHSBase limit-value hierarchy helps you select an appropriate alternative — for example a kick-off value as a statistically-derived conservative starting point.
DOHSBase is listed in the standard itself
EN 689 names DOHSBase. Annex B, “Occupational exposure limit values for compliance testing”, sets out the sources from which you choose the limit value you test against. The standard’s own term for that value is the occupational exposure limit value (OELV) — the same thing this article calls an OEL, and the term you will meet in the EU directives that set indicative (IOELV) and binding (BOELV) values. DOHSBase is listed there as a comprehensive database of occupational hygiene exposure limits, with the reference www.dohsbase.nl/en/.
The other entries in that list are institutional: SCOEL for European binding and indicative limit values, GESTIS from Germany’s IFA/DGUV, the DFG MAK and BAT list, the SER database of Dutch limit values, and the ISSA and French INRS lists. DOHSBase is the only private database among them.
Two qualifications, because precision matters here. Annex B is informative, not normative: the standard lists DOHSBase as an example of a source, it does not prescribe its use. And the listing concerns the database as a source of limit values — not the UTL functionality described below.
One further detail worth noting: the text of that same annex gives the kick-off value as an example of an in-house derived limit value, without attribution. That term comes from the work of Scheffers and Wieling (2005, peer-reviewed in 2016). The methodology has therefore entered the European standard independently of the source listing.
Where to find the standard, and the values to test against
EN 689 describes how to test; the standard itself contains no limit values. A compliance assessment therefore needs two things, from different sources:
1. The standard itself. EN 689:2018+C1:2019 is a paid document (NEN sells the Dutch adoption at roughly € 118). For practical guidance without purchasing it, Arbeidsveiligheid.net publishes a freely accessible guide to applying the standard (Dutch).
2. The limit value you test against. This comes from a source the standard itself points to — which is exactly what Annex B does. In Dutch practice: the statutory value from annex XIII for the legal test, GESTIS for international comparison, a DNEL or kick-off value where no statutory value exists.
The practical trap is the combination. A UTL calculation is only as reliable as the limit value it tests against: correct statistics against an outdated or wrongly chosen value still produce a wrong compliance verdict. That is why Annex B lists a set of sources rather than a single reference — and why DOHSBase shows the source and year alongside each value.
The problem: measurement uncertainty makes naïve testing unreliable
At first glance EN 689 compliance looks like a simple comparison: average TWA versus OEL. If the average is below the limit, the work process complies. If above, it doesn’t.
Two statistical realities make that simple test unreliable:
1. Workplace variability. Exposure concentration varies day-to-day — driven by differences in production volume, work methods, ventilation, weather conditions, and task mix. A series of six measurements provides only an estimate of the mean of the underlying exposure distribution, not the exposures themselves. The fewer measurements, the larger the uncertainty about the true population mean.
2. Measurement uncertainty of the analytical method itself. Every analytical determination — personal-pump air sampling, gravimetric analysis, GC-MS quantification — has a coefficient of variation (CV) that typically falls between 5% and 20%. A reported concentration of 42 mg/m³ with CV=10% means the true concentration could lie anywhere between roughly 34 and 50 mg/m³, with no fault on the part of the measurement method.
Taken together: a TWA average of 42 mg/m³ against an OEL of 45 mg/m³ looks safe — ratio 93.5% — but the real probability that individual workers exceed the OEL on individual days can be substantial. EN 689 explicitly demands that compliance verdicts incorporate this uncertainty rather than ignore it.
The solution: Upper Tolerance Limit (UTL) with Monte Carlo simulation
The international occupational hygiene literature has developed the Upper Tolerance Limit (UTL) as a statistical measure that explicitly incorporates both workplace variability and measurement uncertainty.
A UTL is a statistical upper bound: a value below which, with a specified confidence, a specified percentage of exposures fall. The two percentages you choose determine how strict the test is.
EN 689 sets them at the 95th percentile with 70% confidence, notated UTL₉₅,₇₀ — the standard itself writes the criterion as C₉₅,₇₀% ≤ OELV. In words: there is 70% confidence that no more than 5% of exposures exceed the OEL. That is deliberately less strict than the 95/95 combination common in the American industrial-hygiene tradition; it is how the standard keeps the required number of measurements practically achievable.
If UTL₉₅,₇₀ falls below the OEL, the standard’s criterion is met. DOHSBase Online additionally reports how firm that outcome is: the Monte Carlo simulation gives the probability that the OEL is exceeded anyway, and that probability can be substantial while the point estimate sits below the limit.
Computing the UTL is non-trivial. The classical formula (based on the non-central Student’s t-test, introduced into industrial hygiene in the 1980s) assumes that exposure measurements follow a log-normal distribution — a common assumption in occupational hygiene — and that measurement uncertainty enters the population distribution in a specific way. For small datasets, datasets containing non-detects (values below the limit of detection), or measurement series with asymmetric uncertainties, the closed-form calculation becomes considerably more complex.
Monte Carlo simulation solves this elegantly. Rather than searching for a closed-form formula, the method simulates the measurement process many thousands of times:
- For each measurement in the dataset, draw a random value from a distribution representing the true exposure plus the measurement uncertainty
- Compute the UTL on the simulated dataset
- Repeat many thousands of times — typically 100,000 to 1,000,000 iterations
- The distribution of UTL outcomes yields a statistically robust estimate plus confidence intervals
The advantage: the Monte Carlo approach works for any distribution shape, with or without non-detects, with arbitrary measurement-uncertainty models — and yields a direct estimate of the exceedance probability P(exceedance), which closed-form calculations do not provide.
DOHSBase UTL Compliance — workflow and output
DOHSBase Online has implemented the Monte Carlo UTL method as an interactive tool under Tools → UTL Compliance — Exposure Assessment.
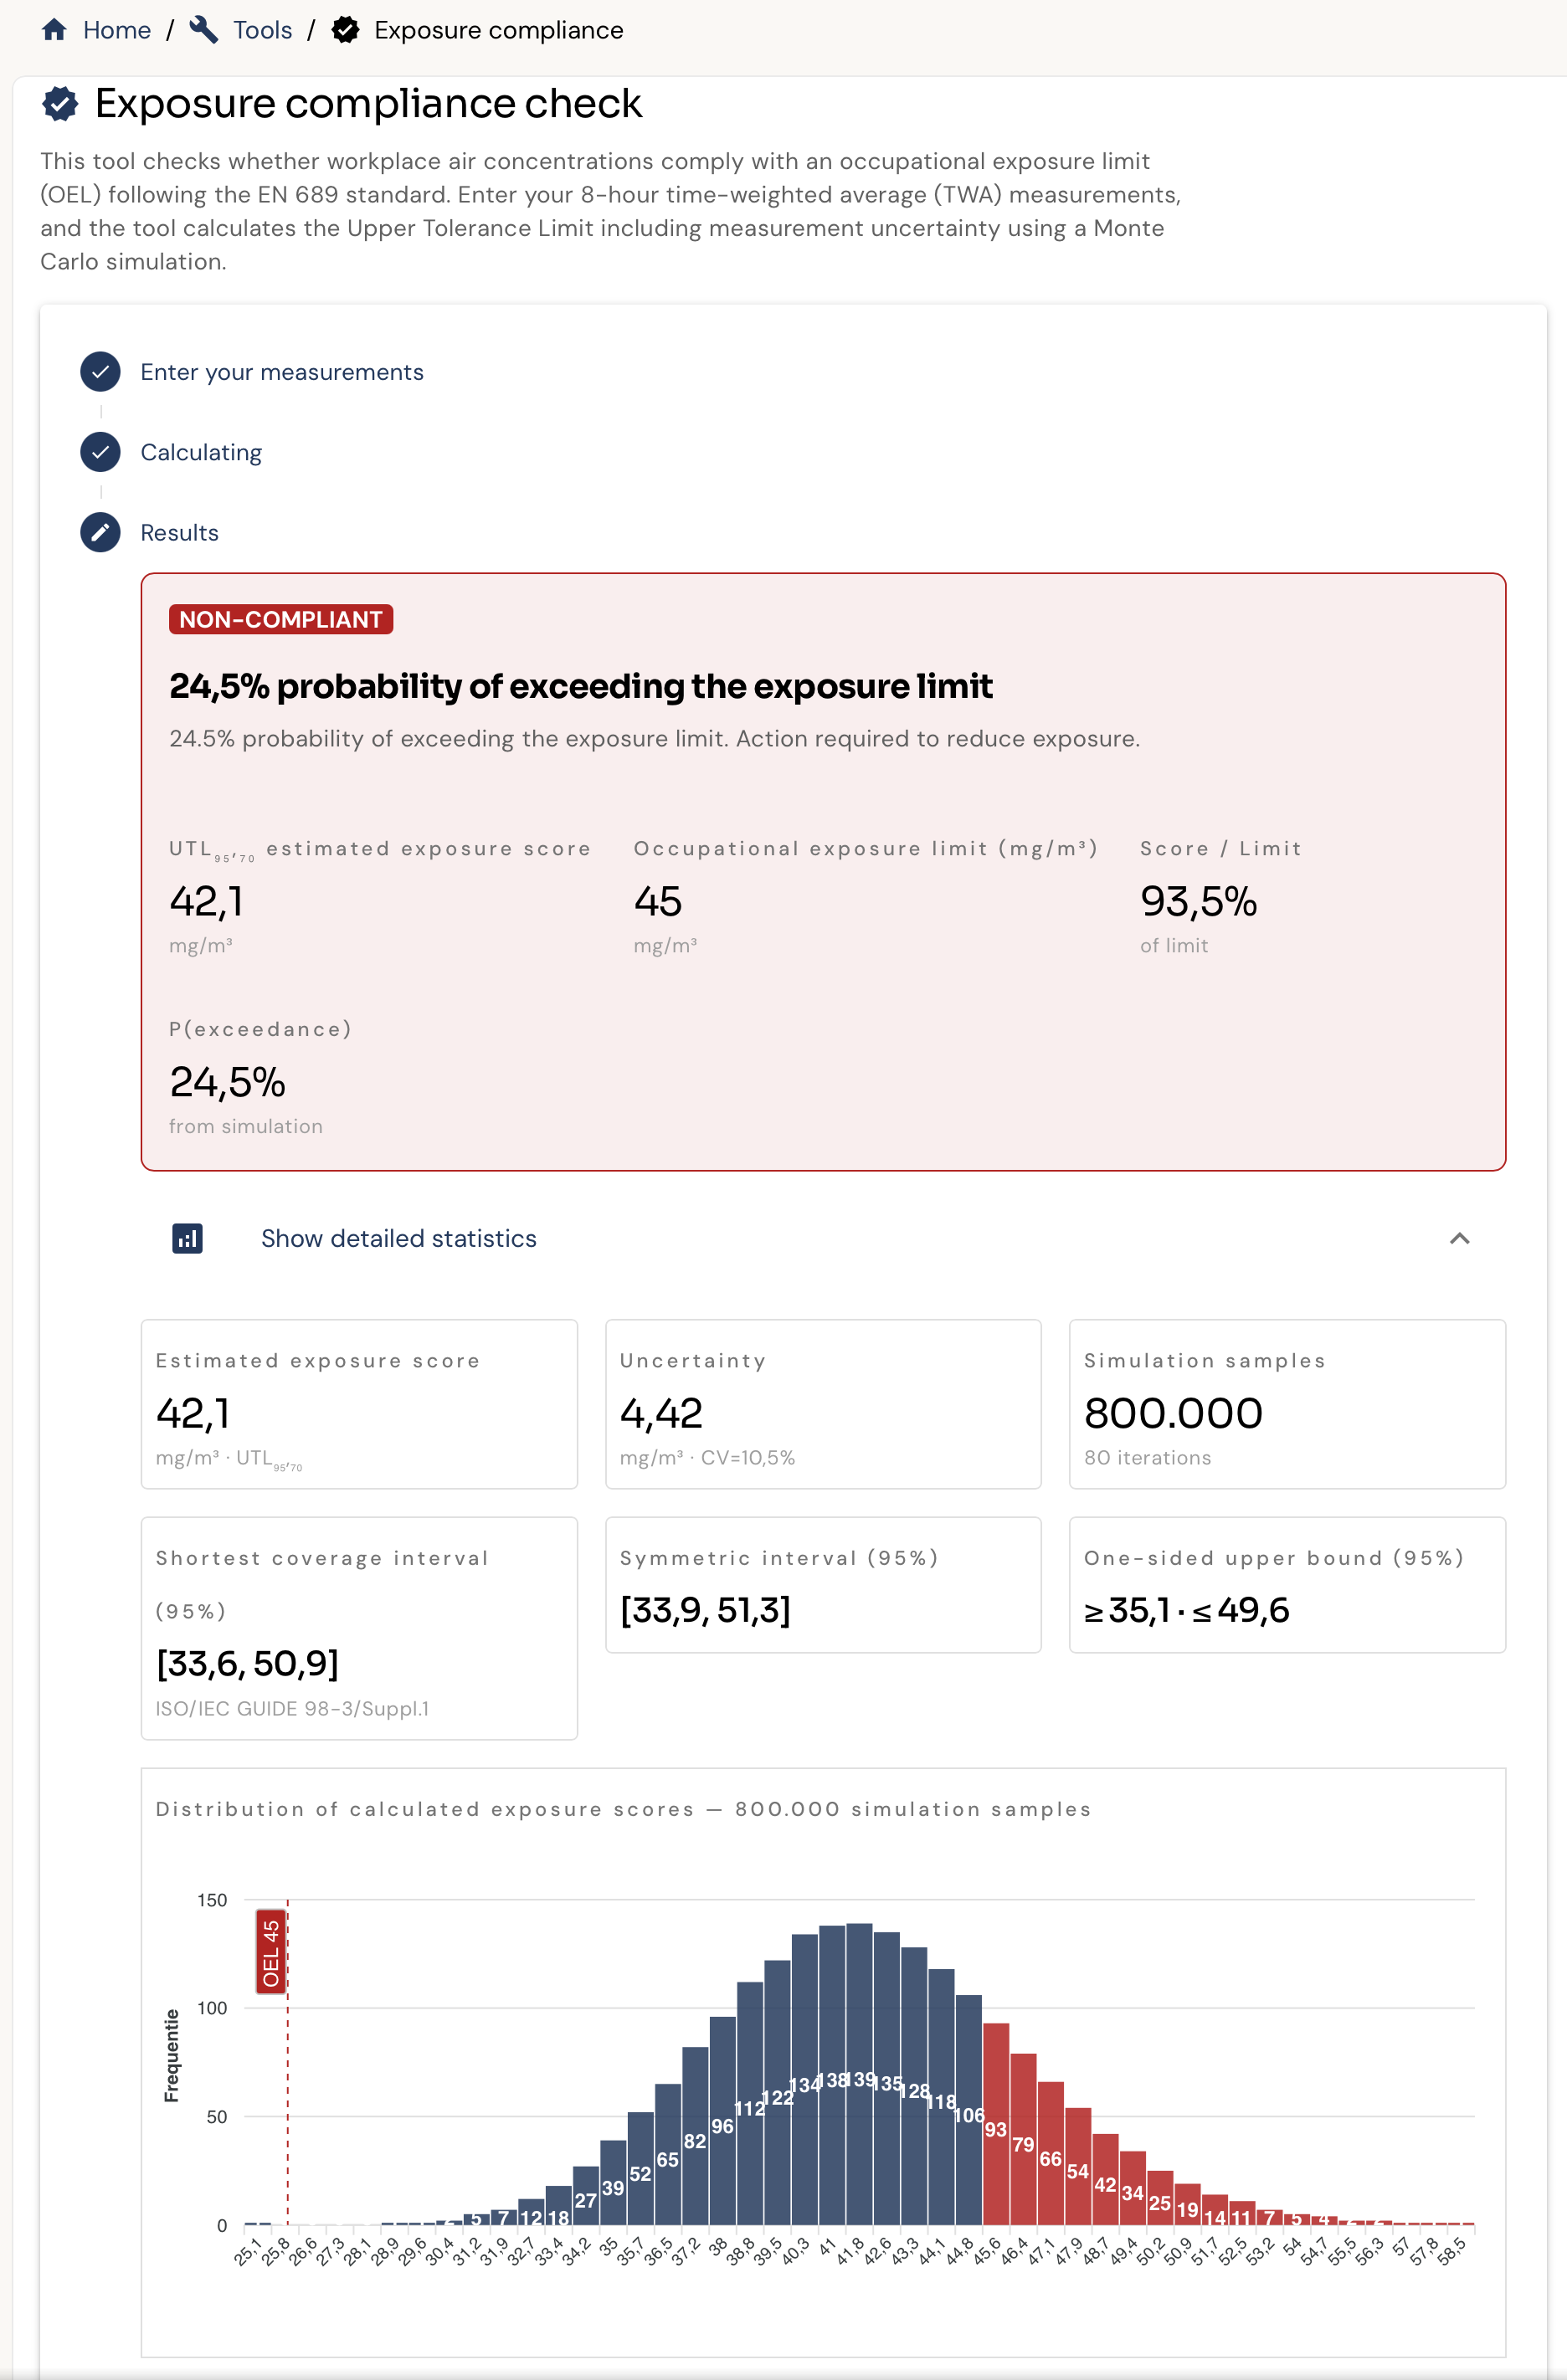
The workflow is a three-step wizard:
1. Measurements. Enter the 8-hour TWA measurement series — concentrations with units (mg/m³ or ppm). For each measurement an optional measurement uncertainty (coefficient of variation) can be supplied; if no specific uncertainty is provided, a reasonable default based on the measurement method is applied. Non-detects (e.g. “<0.5 mg/m³”) are recognised as such and processed correctly in the simulation.
2. Calculate. The substance’s OEL is loaded automatically from the DOHSBase database — 8-hour TWA, STEL, ceiling value, or, when no formal limit exists, the corresponding kick-off value. The Monte Carlo simulation typically runs 800,000 samples across 60 iterations.
3. Results. The tool displays:
- Compliance verdict (“COMPLIANT” or “NON-COMPLIANT”) with the OEL exceedance probability
- UTL₉₅,₇₀ estimate in the same units as the OEL
- Ratio of UTL to OEL
- P(exceedance) — the simulated probability that the true exposure exceeds the OEL
- Confidence intervals per GUM (asymmetric and symmetric) and one-sided
- Histogram of the UTL distribution from the simulation
In a typical example: a measurement series produces a UTL 95% of 42.1 mg/m³ against an OEL of 45 mg/m³. The 93.5% ratio looks safe at a glance, but Monte Carlo simulation reveals a 24.5% probability of exceedance. That makes the work process non-compliant with EN 689 — additional exposure reduction is required. A naïve “average versus OEL” test would have wrongly concluded the process complies.
Background: the work of Emonds, Scheffers and Van Balen
The computational methodology behind DOHSBase Online’s UTL Compliance tool is based on the published work of Robert Emonds (BE), Theo Scheffers (NL) and Peter van Balen (NL) — a Belgian-Dutch collaboration that worked out the Monte Carlo simulation of measurement uncertainty in occupational exposure analysis. The open-source R implementation is available under GPL-2.0 license. The methodology applies the GUM framework (Guide to the expression of Uncertainty in Measurement) for the treatment of measurement uncertainty and the ISO/IEC Guide 98-3/Suppl.1 specification for the Monte Carlo approach.
For readers seeking the comprehensive professional desktop package: TSAC (Theo Scheffers Arbeidshygiene Consultancy) has maintained HYGINIST since 2012 — a specialised Windows application that elaborates the same statistical methodology more extensively, including the EN 689 Annex E, F and H validation examples, between-series comparison, and context-sensitive help. DOHSBase Online’s UTL Compliance is a simplified, web-based implementation tied directly to the DOHSBase OEL and substance database, allowing the compliance verdict to be completed in a single workflow without external tooling.
When is a UTL analysis warranted
Not every measurement series requires a Monte Carlo UTL analysis. UTL Compliance delivers most value in the following situations:
Regulatory audits. Inspectorates increasingly expect compliance verdicts to be statistically grounded. A UTL-based justification with explicit uncertainty analysis is what EN 689 actually demands and is materially stronger than a naïve average-versus-OEL test.
Borderline measurement series. When the average sits close to the OEL (as in the 42 versus 45 example above), a UTL analysis is essential to determine whether the difference is real or falls within the measurement uncertainty.
Limited datasets. When the measurement series is small (four to eight samples), uncertainty about the population mean is large. UTL quantifies this uncertainty explicitly rather than implicitly.
Datasets with non-detects. Traditional closed-form UTL formulas handle non-detects poorly. The Monte Carlo approach handles them correctly by modelling them as uncertain values between zero and the limit of detection.
For datasets where the average sits well below the OEL (ratio under roughly 50%, no non-detects, sufficient measurements), a simple test usually demonstrates compliance. UTL Compliance adds value primarily where margins are tight and the cost of a wrong compliance verdict is high.
Further reading
- Limit-value hierarchy — choosing the right OEL as test reference
- Occupational exposure limits — basic information — TWA, STEL, ceiling and biological limits explained
- Kick-off values — for substances without a formal OEL
- Uncertainty-on-UTL on GitHub — the open-source R implementation by Emonds, Scheffers and Van Balen
- HYGINIST — the comprehensive professional desktop package from TSAC on which this methodology builds
Try DOHSBase Online — look up 10 substances free, including UTL Compliance